Exif data - a statistical approach
I have been recently wondering if my pictures would benefit from a change in perspective, meaning a lens with a different focal length and aperture. I am considering a tele lens because I am thinking of creating pictures more similar to portraits, but this would require a lens with a longer reach... which one? a fast one (f=2.8), a fast-ish one (f=4), or a not so fast lens (5.6-6.3)? If I had a fast-ish lens, would the increase in ISO compensate for the lesser amount of light or should I expect a reduction in image quality? Besides, how often have I used the maximum focal length of my zoom range?
With all these questions in my mind, I addressed this matter the way I kow better: by looking at data.
First of all, I set the goal of retrieving all the picture parameters that are stored in exif data, for every picture of every play in 2022. Then I placed all the results in a big fat excel file and looked at the data through pivot tables. Since the data is there, why not have a look at the mean ISO number for every play? Is there a correlation between ISO number and lighting? As always with data, one question usually leads to another question. I am throwing in this data analysis also about 30 pictures that were taken during a trip on the Dolomites (taken on a bright day of sunshine) as a proof that I can correctly identify the outlier in my data.
My first concern was to determine whether there is one theatre that consistently uses a higher or lower light intensity by looking at computed EV values. Without much surprise, it is clear that improvisational theatre usually takes place at a much more brightly lit stage than classical theatre... at least in my experience. For improv, at least 60% of the pictures range between 5.67 and 7, while for classical theatre the 80% of pictures ranges between 2.67-7.3 in one theatre, and 4-6.3 in another. There is also a significant difference between the range of EV values of the two different classical theatres, the first uses lights with much greater variety and uses lights to add depth to the scene, while the second one usually prefers less pronounced variations between scenes in the same play. As a side note, my holiday pictures outshine all the other pictures with 100% of the EV values between 12.3 and 13, definitely much brighter than any indoor lighting can achieve: even if this fact should not be surprising, it is and important confirmation that the EV data represent a real fact and can be trusted.

Let us have a look at how ISO values are distributed for all the pictures taken in the three different categories. Similarly to what we have noticed for EV values, there is a significant difference between improvisational theatre and classical theatre. The typical ISO values of the two classical theatres have a different spread but similar mean values.
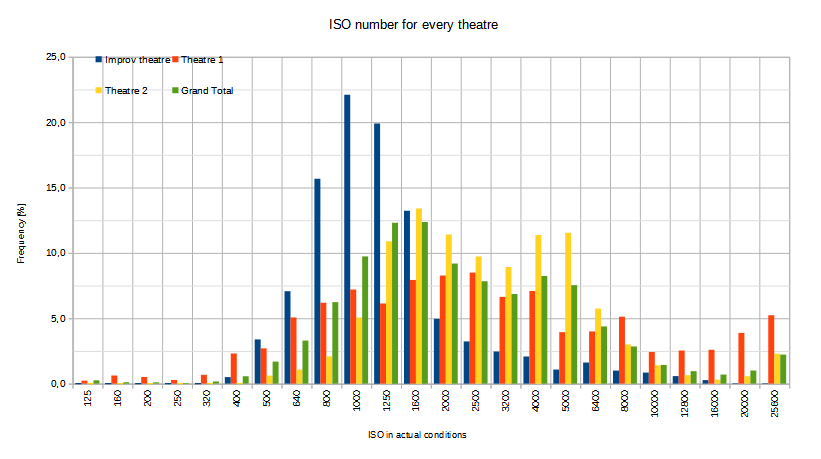
Let us try to determine how the ISO number would have changed if I had used a f=4 lens for all the pictures. Since the actual pictures are mostly taken at f=2.8 or f=3.2, the simplest solution is adding one stop to the actual ISO number and accept 1/3 stop error in the results. As an alternative, it is possible to calculate, for every picture, the equivalent ISO at f=4 for that particular EV value. I have followed the latter approach for the sake of precision, and also because the increase in complexity is acceptable.

If we decide that image quality is acceptable for all the pictures at ISO 6400 and lower, the improvisational theatre pictures would be totally acceptable in at least 80% of the instances, while picture quality would certainly worsen for the classical theatre plays. In both cases, the average ISO number would become close to 4000 and the 80th percentile of the pictures would fall in the range 25600 - 10000, which is in both cases a visible drop in picture quality.
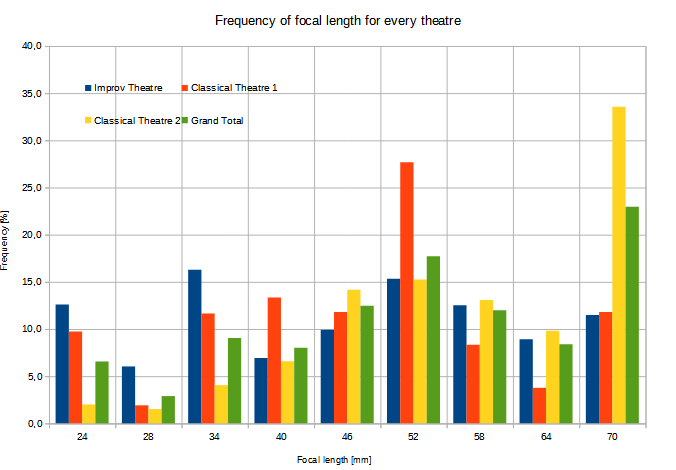
Let us assess which focal lengths are most frequent. Since these data range from 24 to 70 mm, and every possible value in this range is represented, data were aggregated by binning. This operation can affect the evaluation of the data, even if it is almost necessary to achieve an understanding of trends and use cases. Values 24 and 70 were assigned one bin each, since they fall exactly at the ends of the range; 27 and 29 were binned as 28 (curiously the value 28 never showed up), all the values from 31 to 67 were placed in 6 equally spaced bins. The data is more sparse and less straightforward to assess than the EV and ISO values, however if we look at the relative frequency of the focal lengths we can find some patterns. First of all, the wide and tele end of the zoom (24 mm and 70 mm) each make up a significant percentage of the overall pictures. By looking at cumulative frequencies, the mean value of the frequency distribution (the focal length intersecting cumulative freq = 50%) is 46-55 for all three theatres, but classical theatre 2 generally shows that more pictures are taken near the tele end of the zoom range. This can be explained by the greater distance of my usual shooting position from the stage than for the other two theatres. By looking at frequency histogram, it is quite clear that all three theatres have more than 15% of the pictures taken at 52 mm, which can be dictated by relative distance to the stage but also by personal preference. A possible interpretation of the focal range data from a photographic point of view is the following: even if my pictures are preferably taken at wide focal lengths, the zoom I am using might restrict creative choices because many pictures are taken at the end of the tele range. However, in the greatest majority of situations, the zoom I am using seems to be suited for the situations where it is used; this idea is corroborated by the fact that the mean focal length falls in the range 46-55 mm. It is also possible that the greatest occurrence of 46-55 mm could be caused by my personal preference because it allows a composition made of 3 or more people in the same frame.